Reports
Reports in Koha are a way to gather data. Reports are used to generate statistics, member lists, shelving lists, or any list of data in your database.
- Get there: More > Reports
Custom reports
Koha’s data is stored in a MySQL database which means that librarians can generate nearly any report they would like by either using the guided reports wizard or writing their own SQL query.
Add custom report
Guided report wizard
Der Geführte Reports-Assistent führt Sie in sechs Schritten durch die Generierung eines Reports.
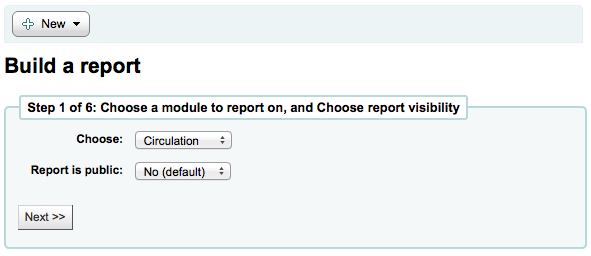
Step 1: Choose the module you want to report on. This will determine what tables and fields are available for you to query.
‚Report is public‘ should be left to the default of ‚No‘ in most cases especially if the report contains patron or other sensitive information. A public report can be accessed using the JSON reports services by anyone and without authentication.
Hinweis
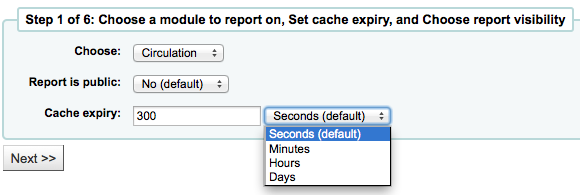
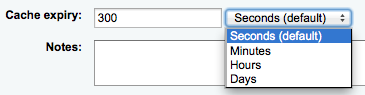
If your system administrator has set up memcache on your server you might see one more option for the Cache expiry. This is related to your public reports. If you make the report public then it’s constantly running and will cause a large load on your system. Setting this value prevents that.
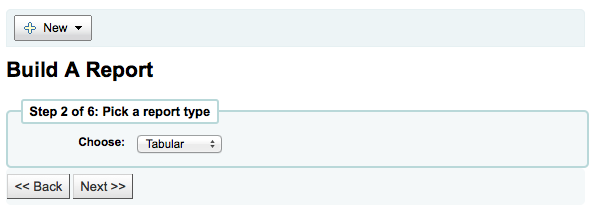
Step 2: Choose a report type. For now, Tabular is the only option available.
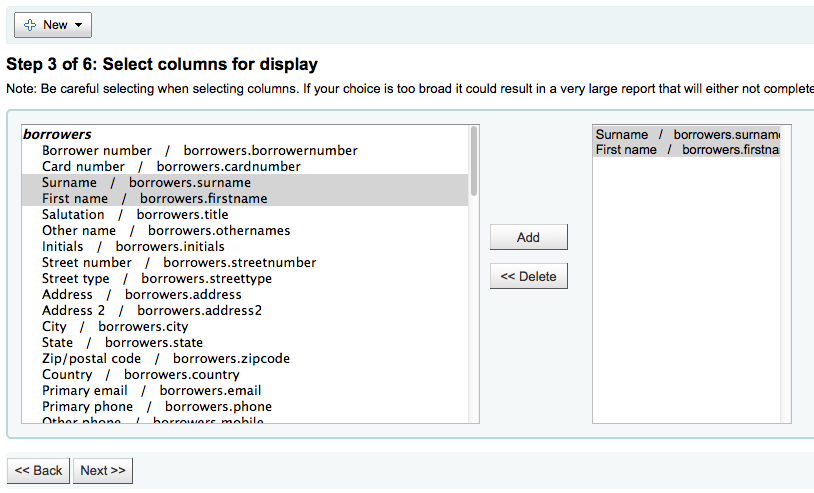
Step 3: Choose the fields you want in your report. You can select multiple fields and add them all at once by using CTRL+click on each item you want to add before clicking the Add button.
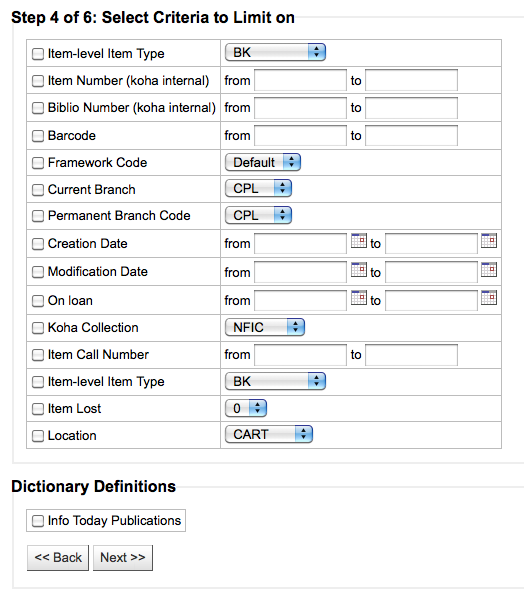
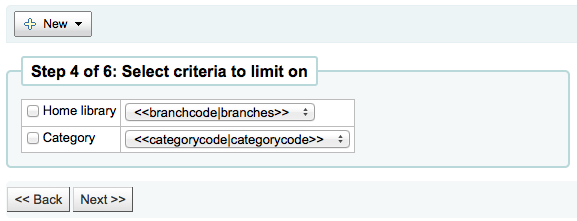
Step 4: Choose any limits you might want to apply to your report (such as item types or branches). If you don’t want to apply any limits, simply click ‚Next‘ instead of choosing an option.
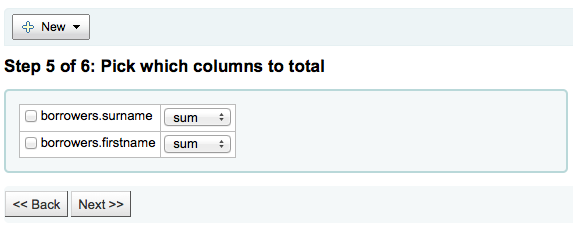
Step 5: Perform math functions. If you don’t want to do any calculations, simply click ‚Next‘ instead of choosing an option.
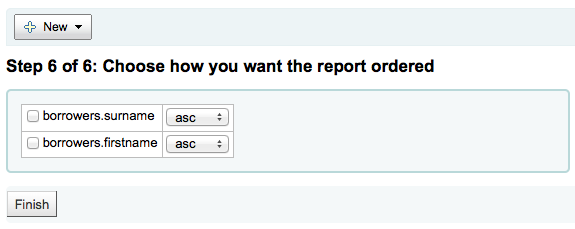
Step 6: Choose data order. If you want the data to print out in the order it’s found in the database, simply click ‚Finish‘.
Wenn dieser Schritt abgeschlossen ist, wird das durch den Assistenten generierte SQL angezeigt. Von hier aus können Sie den Report abspeicern oder das SQL kopieren und noch manuell weiter bearbeiten.
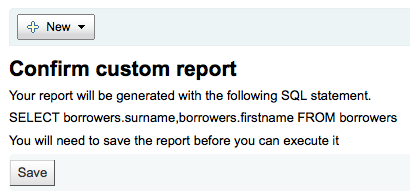
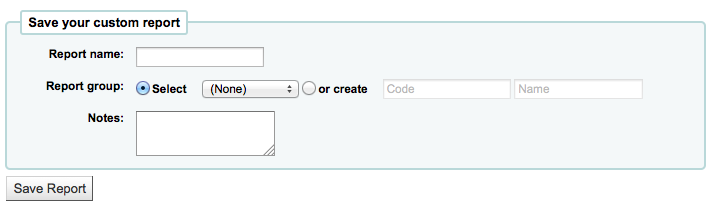
Wenn Sie entscheiden den Report zu speichern, werden Sie aufgefordert einen Namen für den Bericht einzugeben sowie die Gruppe und Untergruppe zu wählen, in denen der Report einsortiert werden soll.
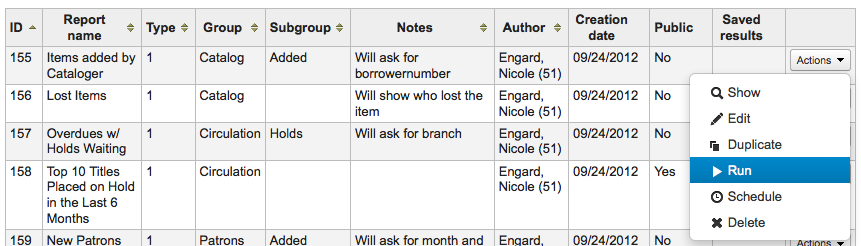
Once your report is saved it will appear on the ‚Use saved‘ page with all other saved reports.
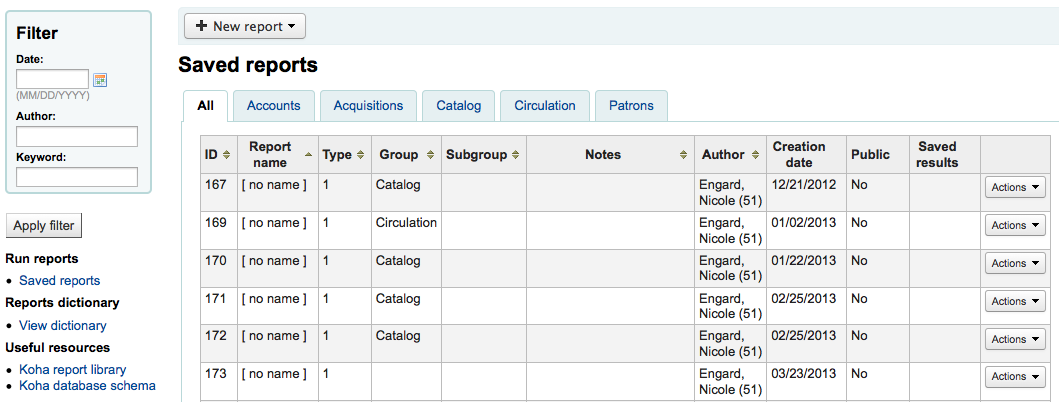
Von hier aus können Sie den Report bearbeiten, ausführen oder eine Zeit festlegen, an dem er automatisch ausgeführt wird. Um den Report zu finden, den Sie angelegt haben, können Sie die verschiedenen Spalten durch Anklicken der Spaltenüberschrift sortieren (über das Erstellungsdatum finden Sie neu angelegte Reports am schnellsten). Sie können die Liste der Reports auch über die Filter auf der linken Seite einschränken oder über Reiter zwischen verschiedenen benutzerdefinierten Gruppen auswählen.
SQL-Report
In addition to the report wizard, you have the option to write your own queries using SQL. To find reports written by other Koha users, visit the Koha wiki: http://wiki.koha-community.org/wiki/SQL_Reports_Library. You can also find your database structure in /installer/data/mysql/kohastructure.sql or online at: http://schema.koha-community.org
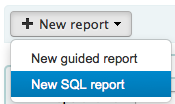
Um eigene Abfragen hinzuzufügen, klicken Sie auf der Seite ‚Reports‘ auf den Link ‚Neuer SQL-Report‘ oder oben auf der Seite ‚Gespeicherte Reports‘ auf die Schaltfläche ‚Neuer Report‘.
Füllen Sie das angezeigte Formular aus
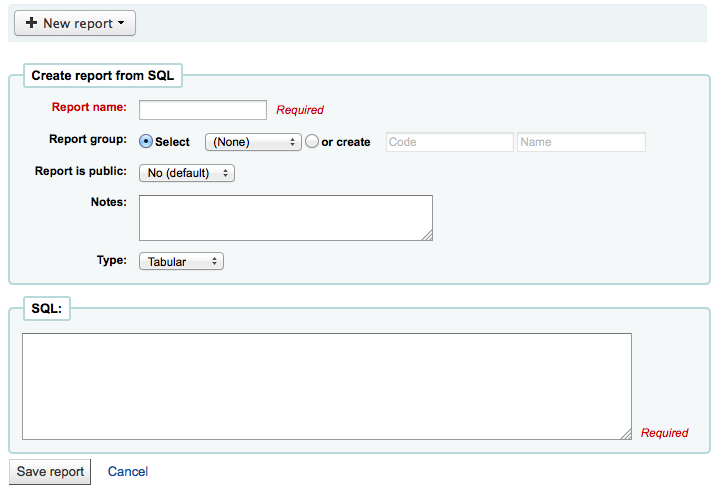
Der Name dient zur späteren Identifizierung des Reports. Er wird in der Liste der gespeicherten Reports angezeigt und kann dort auch gesucht werden.
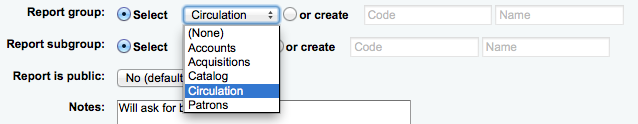
You can use the ‚Report group‘ to organize your reports so that you can easily filter reports by groups. Report groups are set in the REPORT_GROUP authorized value category or can be added on the fly when creating the report by choosing the ‚or create‘ radio button.
Report groups set up in the authorised value category need to have unique authorised values and descriptions.
Hinweis
If you’re adding a report group on the fly, remember that you code should be fewer than 10 characters and should not include special characters or spaces.
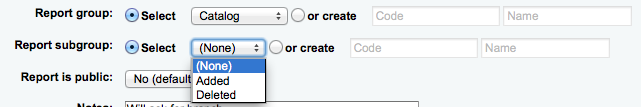
You can use ‚Report subgroup‘ to further organize your reports so that you can easily filter reports by groups and subgroups. Report subgroups are set in the REPORT_SUBGROUP authorized value category or can be added on the fly when creating the report by choosing the ‚or create‘ radio button. Report subgroups are set up with unique values in ‚Authorised value‘, and ‚Description‘. The ‚Description (OPAC)‘‘ field needs to contain the authorised value for the report group that the subgroup falls under.
Hinweis
If you’re adding a report subgroup on the fly, remember that you code should be fewer than 10 characters and should not include special characters or spaces.
- ‚Report is public‘ should be left to the default of ‚No‘ in most cases
especially if the report contains patron or other sensitive information. A public report can be accessed using the JSON reports services by anyone and without authentication.
‚Notes‘ will also appear on the saved reports page, this can be used to provide more details about the report or tips on how to enter values when it runs
Als Typ sollte immer ‚Tabellarisch‘ ausgewählt werden, da die anderen Formate noch nicht implementiert sind.
Im SQL-Eingabefeld können Sie die SQL-Abfrage eingeben oder einkopieren.
Hinweis
If your system administrator has set up memcache on your server you might see one more option for the Cache expiry. This is related to your public reports. If you make the report public then it’s constantly running and will cause a large load on your system. Setting this value prevents that.
Once everything is entered click the ‚Save report‘ button and you’ll be presented with options to run it. Once a report is saved you do not have to recreate it you can simply find it on the Saved Reports page and run or edit it.
Report writing tips
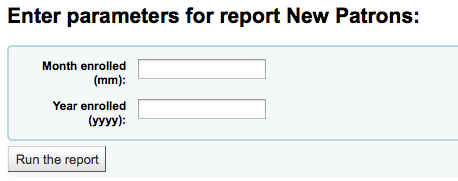
Runtime parameters
If you feel that your report might be too resource intensive you might want to consider using runtime parameters to your query. Runtime parameters basically make a filter appear before the report is run to save your system resources.
There is a specific syntax that Koha will understand as ‚ask for values when running the report‘. The syntax is <<Question to ask|authorized_value>>.
The << and >> are just delimiters. You must put << at the beginning and >> at the end of your parameter
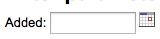
Die ‚Frage‘ wird links vom einzugebenden Begriff angezeigt.
The authorized_value can be omitted if not applicable. If it contains an authorized value category, ‚branches‘, ‚itemtype‘, ‚categorycode‘, ‚biblio_framework‘, a list with the Koha authorized values will be displayed instead of a free field.
Hinweis
You can have more than one parameter in a given SQL query.
Hinweis
You have to put „%“ in a text box to ‚leave it blank‘. Otherwise, it literally looks for „“ (empty string) as the value for the field. For example entering nothing for: „title=<<Enter title>>“ will display results with title=‘‘ (no title). If you want to have to have something not mandatory, use „title like <<Enter title>>“ and enter a % at run time instead of nothing.
Hinweis
To generate a date picker calendar to the right of the field when running a report you can use the ‚date‘ keyword like this: <<Enter Date|date>>
List of parameters that can be used in runtime parameters
| Parameter | What the user sees | What gets inserted in query |
| date branches itemtypes categorycode biblio_framework (auth-value-category) (nothing) | date picker drop down of branch names drop down of item type names drop down of patron category descriptions drop down of MARC bibliographic frameworks drop down of auth-value descriptions in category text box | validly formatted date branch code item type borrower category code framework code authorized value entered text |
Examples:
- SELECT surname, firstname FROM borrowers WHERE branchcode=<<Enter patron’s library|branches>> AND surname like <<Enter filter for patron surname (% if none)>>
- SELECT * FROM items WHERE homebranch = <<Pick your branch|branches>> and barcode like <<Partial barcode value here>>
- SELECT title, author FROM biblio WHERE frameworkcode=<<Enter the frameworkcode|biblio_framework>>
Duplicate report
Reports can also be added by duplicating an existing report. Visit the ‚Saved reports‘ page to see all of the reports listed on your system already.
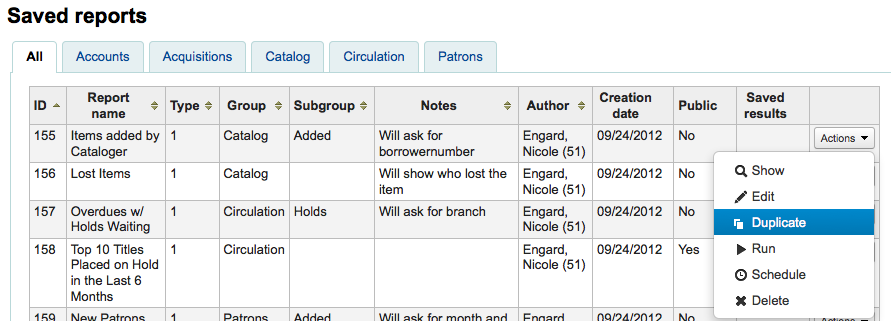
Auf der rechten Seite jeden Reports finden Sie ein Menü ‚Aktionen‘. Klicken Sie auf dieses und wählen Sie ‚Duplizieren‘ um einen existierenden Report als Ausgangspunkt für einen neuen Report zu nutzen. Sie können dann das SQL entsprechend anpassen und abspeichern.
Edit custom reports
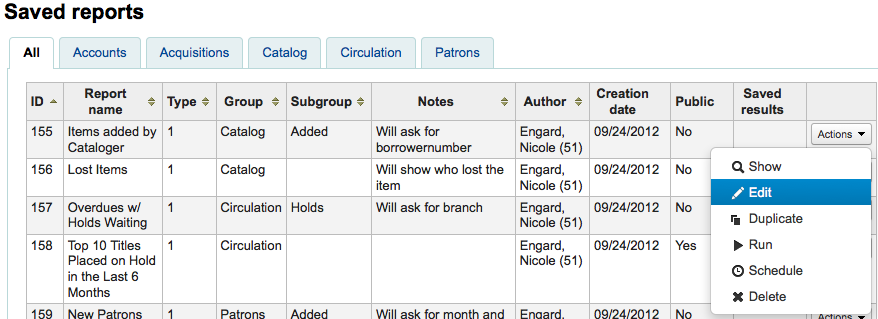
Every report can be edited from the reports lists. To see the list of reports already stored in Koha, click ‚Use saved.‘
Um den Report zu finden können Sie die Tabelle über einen Klick auf die Spaltenüberschriften sortieren. Sie können die Liste der angezeigten Reports auch über die Filter auf der linken Seite einschränken oder über die Reiter zwischen verschiedenen benutzerdefinierten Gruppen wechseln.
Aus dieser Liste heraus können Sie Ihren benutzerdefinierten Report bearbeiten, indem Sie auf ‚Aktionen‘ rechts neben dem Report klicken und ‚Bearbeiten‘ aus dem Menü auswählen.
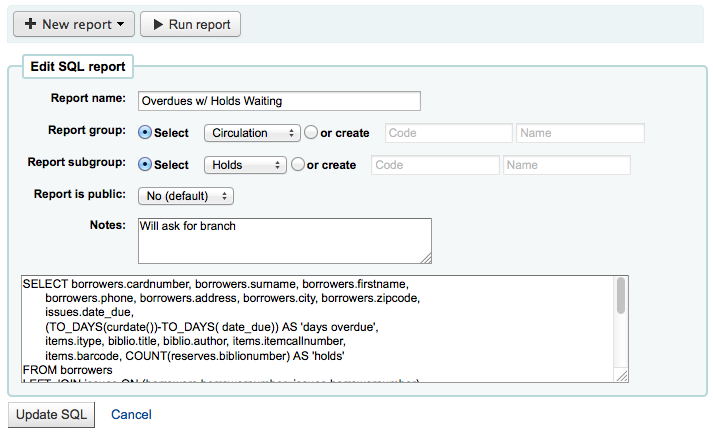
Es wird ein Formular angezeigt, über das der Report bearbeitet werden kann.
Running custom reports
Wenn ein benutzerdefinierter Report in Koha gespeichert wurde, können Sie diesen unter ‚Gespeicherte Reports‘ finden und über den Eintrag ‚Ausführen‘ im Menü ‚Aktionen‘ starten.
When you report runs you will either be asked for some values
or you will see the results right away
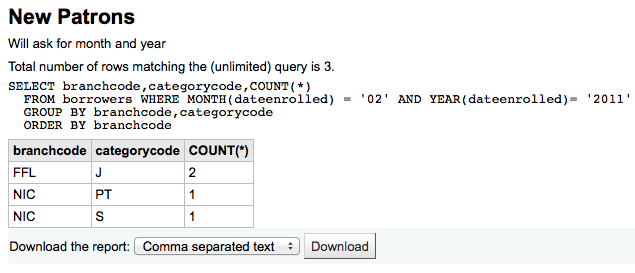
Von der Ergebnisseite aus können Sie über die Schaltflächen am Seitenanfang den Report erneut ausführen, ihn bearbeiten oder einen neuen Report anlegen. Sie können das Ergebnis der Abfrage auch herunterladen indem Sie einen Dateityp wählen und dann ‚Download‘ anklicken.
Hinweis
A comma separated text file is a CSV file and it can be opened by any spreadsheet application.
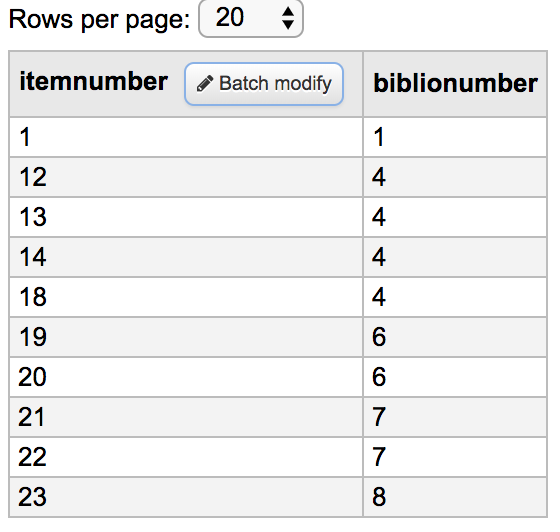
Send itemnumbers to batch item modification
After running a report that contains itemnumbers the list of numbers can be imported directly into Stapelbearbeitung von Exemplaren by clicking the batch modify button in the report results.
Statistics reports
Statistic reports will show you counts and sums. These reports are all about numbers and statistics, for reports that return more detailed data, use the Guided report wizard. These reports are limited in what data they can look at, so it’s often recommended to use custom reports for official end of the year statistics.
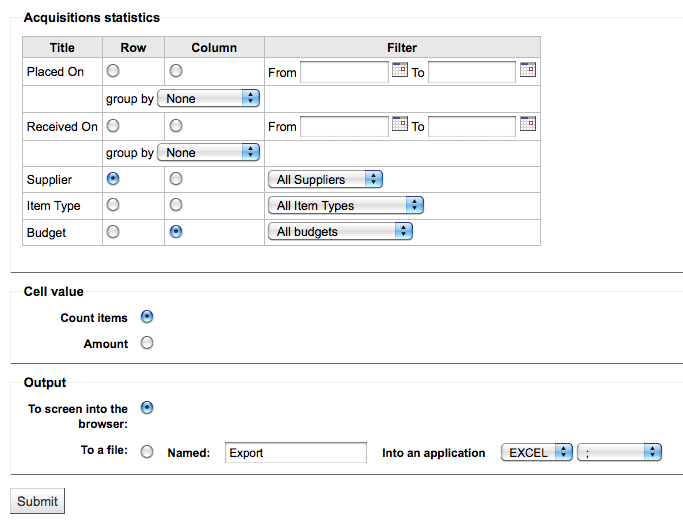
Acquisitions statistics
Hinweis
These reports are limited in what data they can look at, so it’s often recommended to use custom reports for official end of the year statistics.
Using the form provided, choose which value you would like to appear in the column and which will appear in the row.
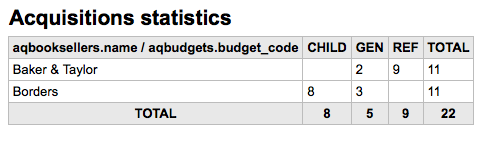
Wenn Sie sich für die Ausgabe im Browser entscheiden, werden die Ergebnisse direkt angezeigt.
Sie können auch eine Datei exportieren und dann mit anderen Werkzeugen weiter bearbeiten.
Wenn Sie einen Report erstellen, können Sie zwischen der Anzahl und der Summe von Werten wählen.
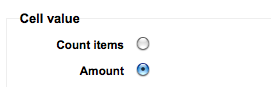
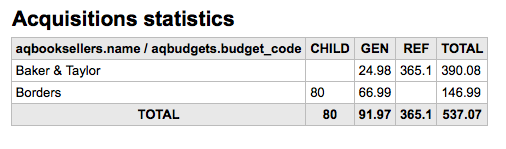
Wenn Sie Summe wählen, werden in der Trefferliste die Summen der gezahlten Gebühren angezeigt.
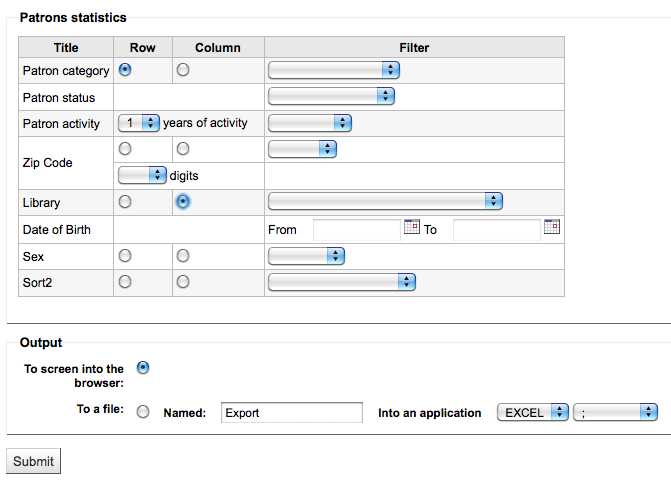
Patron statistics
Hinweis
These reports are limited in what data they can look at, so it’s often recommended to use custom reports for official end of the year statistics.
Using the form provided, choose which value you would like to appear in the column and which will appear in the row.
Wenn Sie sich für die Ausgabe im Browser entscheiden, werden die Ergebnisse direkt angezeigt.
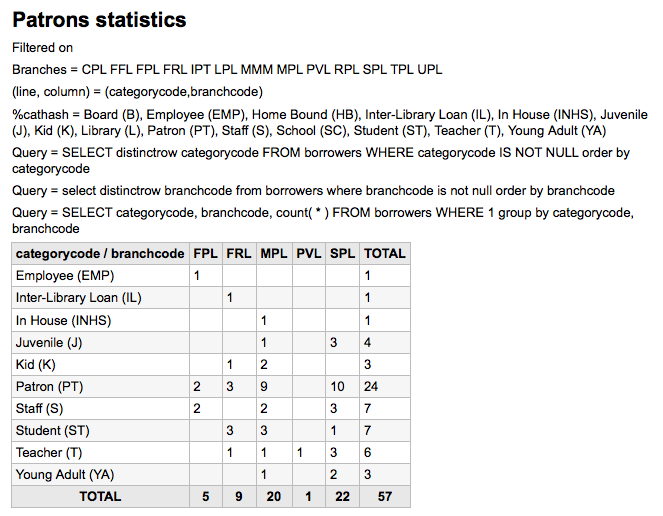
Ausgehend von Ihrer Auswahl werden Ihnen Informationen über der Ergebnistabelle angezeigt. Sie können sich auch entscheiden, die Datei zu exportieren und in einem anderen Programm weiter zu bearbeiten.
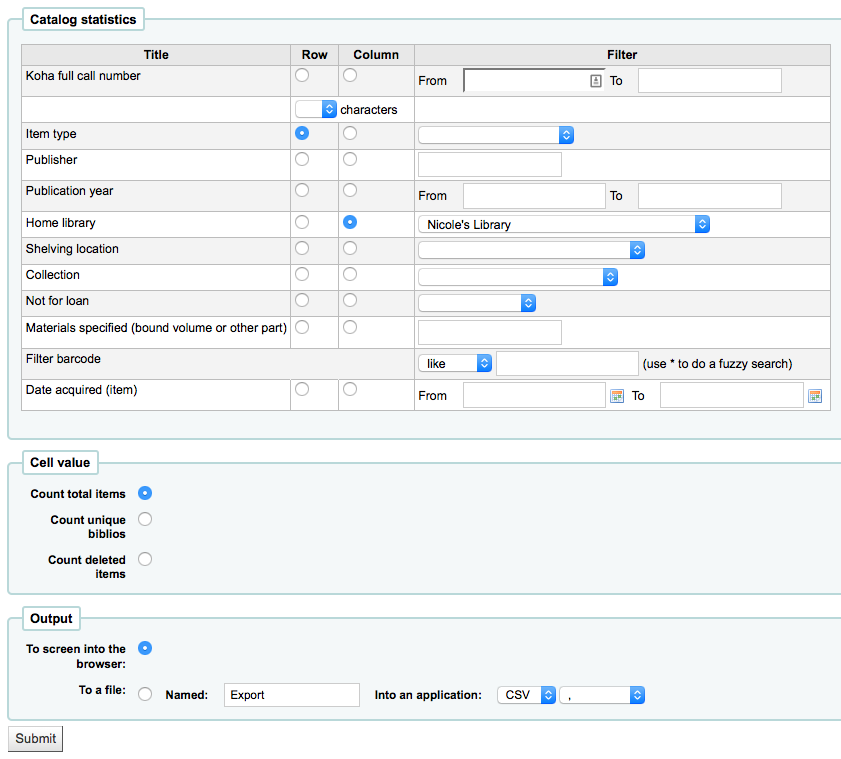
Catalog statistics
Hinweis
These reports are limited in what data they can look at, so it’s often recommended to use custom reports for official end of the year statistics.
Using the form provided, choose which value you would like to appear in the column and which will appear in the row.
Wenn Sie sich für die Ausgabe im Browser entscheiden, werden die Ergebnisse direkt angezeigt.
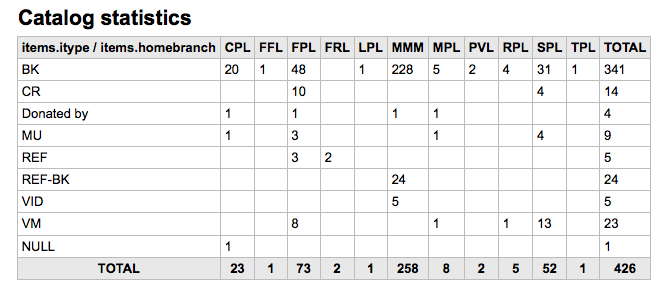
Sie können auch eine Datei exportieren und dann mit anderen Werkzeugen weiter bearbeiten.
Circulation statistics
Hinweis
These reports are limited in what data they can look at, so it’s often recommended to use custom reports for official end of the year statistics.
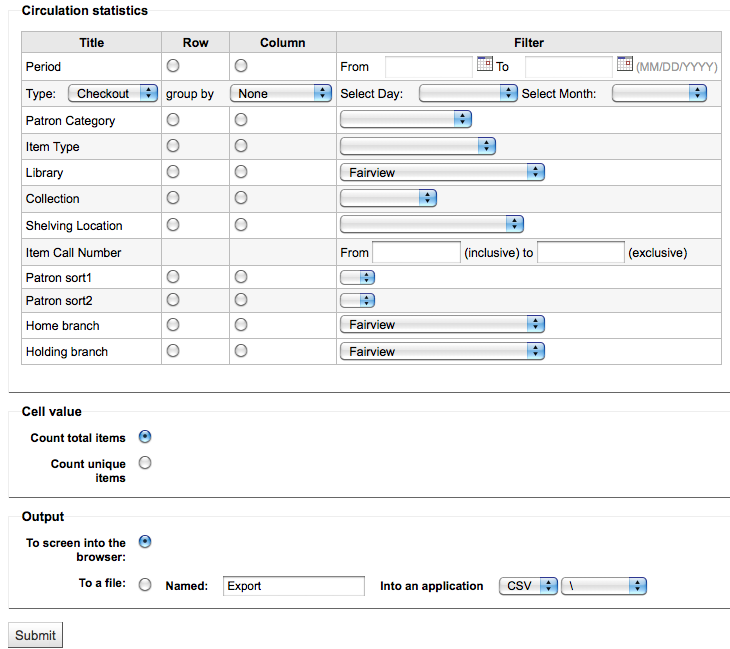
Using the form provided, choose which value you would like to appear in the column and which will appear in the row.
Wenn Sie sich für die Ausgabe im Browser entscheiden, werden die Ergebnisse direkt angezeigt.
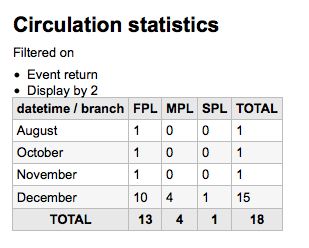
Sie können auch eine Datei exportieren und dann mit anderen Werkzeugen weiter bearbeiten.
Hinweis
To get a complete picture of your monthly or daily circulation, you can run the report twice, once for ‚Type‘ of ‚Checkout‘ and again for ‚Renewal.‘
This report uses ‚Period,‘ or date, filtering that allows you to limit to a month by simply selecting the first day of the first month through the first day of the next month. For example, 10/1 to 11/1 to find statistics for the month of October.
- To find daily statistics, set your date range.</br> Example: „I want circulation data starting with date XXX up to, but not including, date XXX.“
- Für einen ganzen Monat, wäre ein Datumsbereich zum Beispiel: 01/11/2009 bis 01/12/2009
- Für ein ganzes Jahr, wäre der Datumsbereich zum Beispiel 01/01/2009 bis 01/01/2010
- Für einen einzelnen Tag geben Sie z.B. 15/11/2009 bis 16/11/2009 an, um herauszufinden, was am 15. ausgeliehen wurde
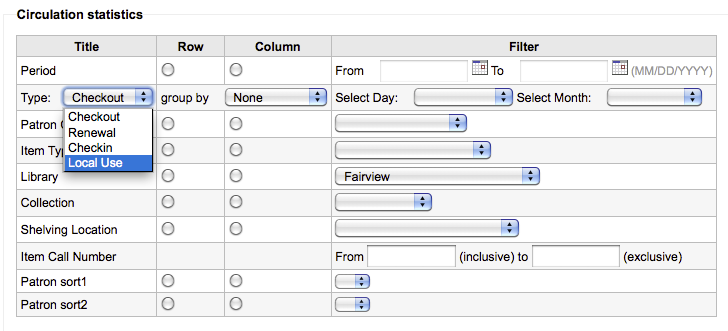
Tracking in house use
Using the Circulation statistics reporting wizard you can run reports on in house usage of items simply by choosing ‚Local use‘ from the ‚Type‘ pull down:
Serials statistics
Hinweis
These reports are limited in what data they can look at, so it’s often recommended to use custom reports for official end of the year statistics.
Verwenden Sie das Formular um festzulegen, wie die Zeitschriften in Ihrem System aufgelistet werden sollen.
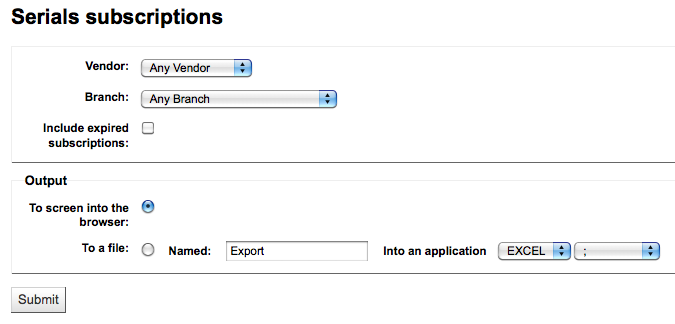
Wenn Sie sich für die Ausgabe im Browser entscheiden, werden die Ergebnisse direkt angezeigt.
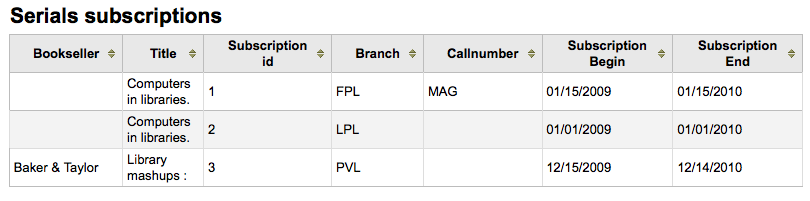
Sie können auch eine Datei exportieren und dann mit anderen Werkzeugen weiter bearbeiten.
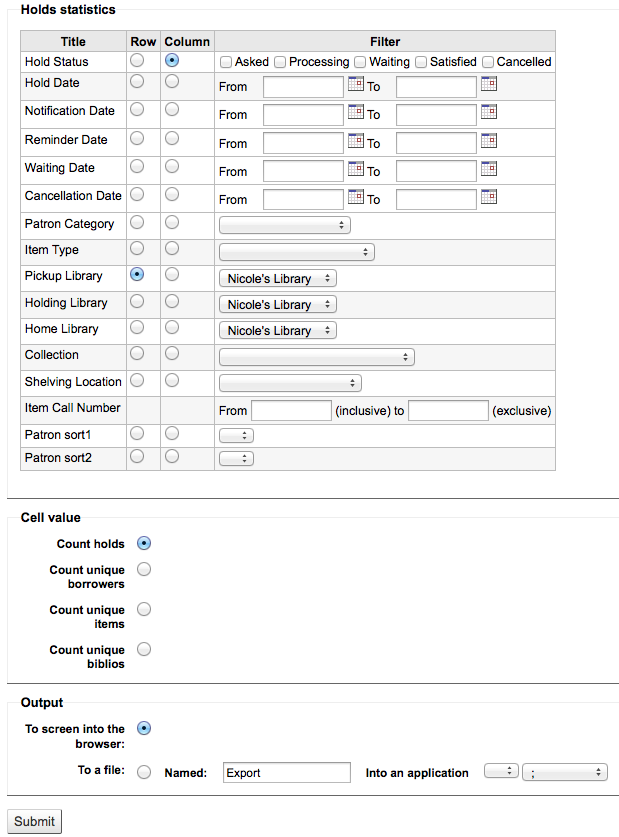
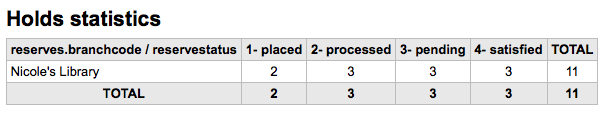
Holds statistics
Hinweis
These reports are limited in what data they can look at, so it’s often recommended to use custom reports for official end of the year statistics.
Wenn Sie das Statistikformular verwenden, können Sie Statistiken über gesetzte, erfüllte und stornierte Vormerkungen und weiteres erstellen. Wählen Sie, welche Information in den Zeilen und welche in den Spalten angezeigt werden soll. Sie können außerdem die Filter auf der rechten Seite des Formulars verwenden.
Wenn Sie sich für die Ausgabe im Browser entscheiden, werden die Ergebnisse direkt angezeigt.
Sie können auch eine Datei exportieren und dann mit anderen Werkzeugen weiter bearbeiten.
Benutzer mit den meisten Ausleihen
Dieser Report zeigt Ihnen, welche Benutzer die meisten Exemplare ausgeliehen haben.
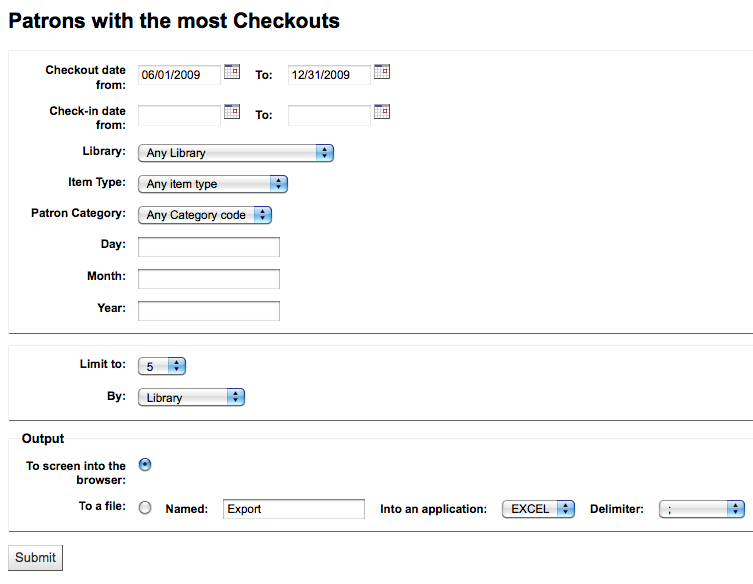
Wenn Sie sich für die Ausgabe im Browser entscheiden, werden die Ergebnisse direkt angezeigt.
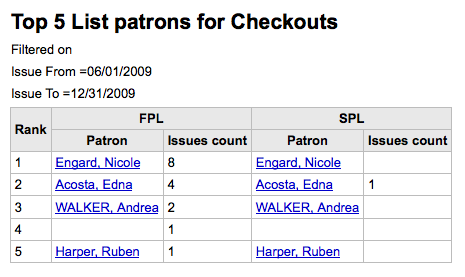
Sie können auch eine Datei exportieren und dann mit anderen Werkzeugen weiter bearbeiten.
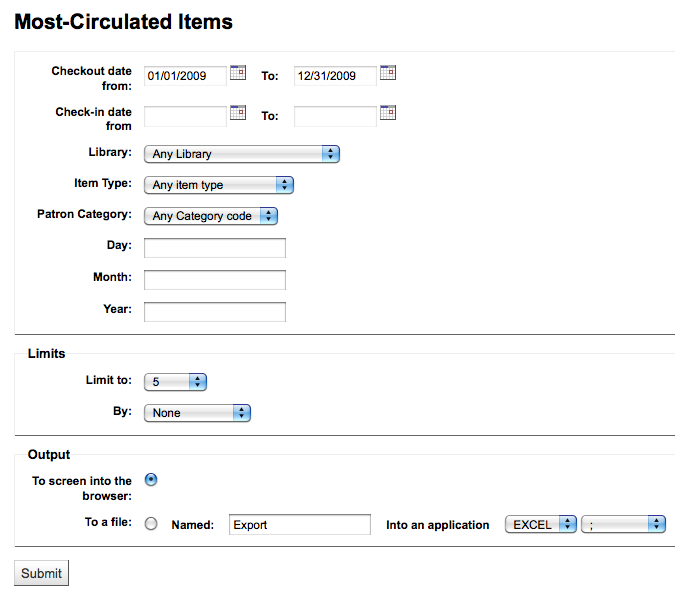
Most circulated items
Dieser Report zeigt Ihnen, welche Exemplare am häufigsten ausgeliehen wurden.
Wenn Sie sich für die Ausgabe im Browser entscheiden, werden die Ergebnisse direkt angezeigt.
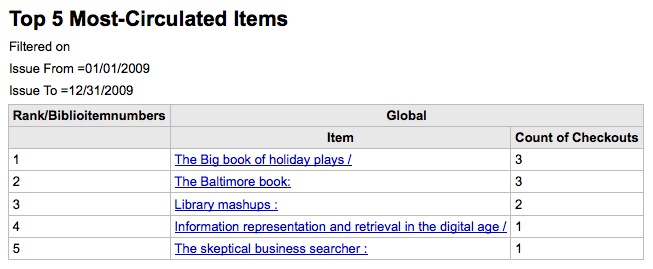
Sie können auch eine Datei exportieren und dann mit anderen Werkzeugen weiter bearbeiten.
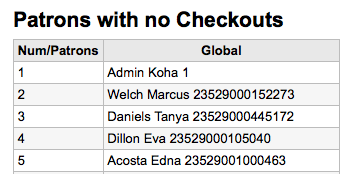
Benutzer ohne Ausleihen
Dieser Report zeigt an, welche Benutzer zur Zeit nichts entliehen haben.
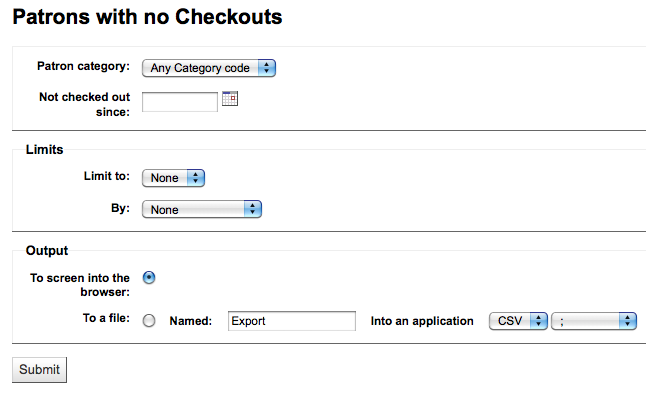
Wenn Sie sich für die Ausgabe im Browser entscheiden, werden die Ergebnisse direkt angezeigt.
Sie können auch eine Datei exportieren und dann mit anderen Werkzeugen weiter bearbeiten.
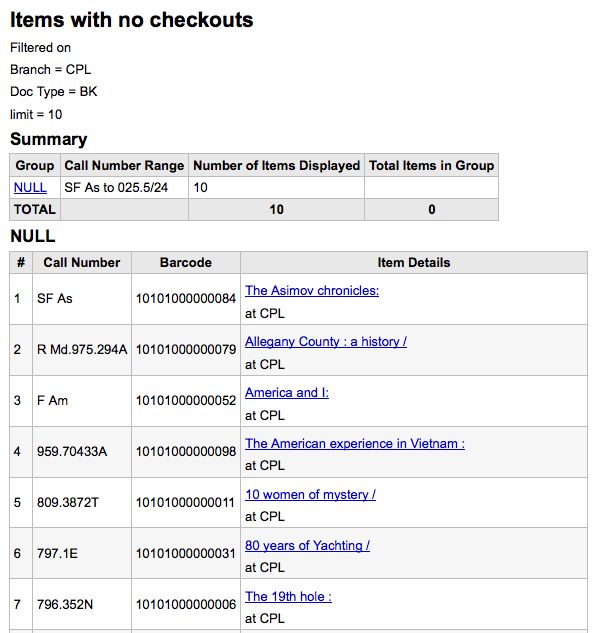
Exemplare ohne Ausleihen
Dieser Report listet alle Exemplare in Bestand, die noch nie ausgeliehen wurden.
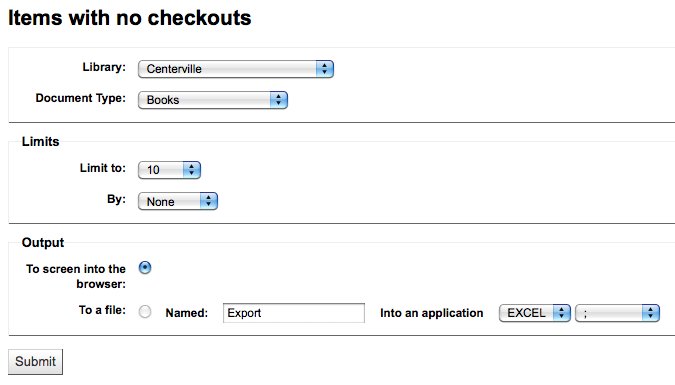
Wenn Sie sich für die Ausgabe im Browser entscheiden, werden die Ergebnisse direkt angezeigt.
Sie können auch eine Datei exportieren und dann mit anderen Werkzeugen weiter bearbeiten.
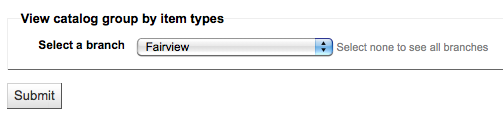
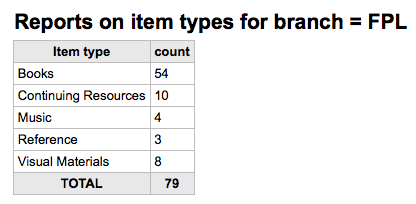
Catalog by item type
This report will list the total number of items of each item type per branch.
Wenn Sie sich für die Ausgabe im Browser entscheiden, werden die Ergebnisse direkt angezeigt.
Sie können auch eine Datei exportieren und dann mit anderen Werkzeugen weiter bearbeiten.
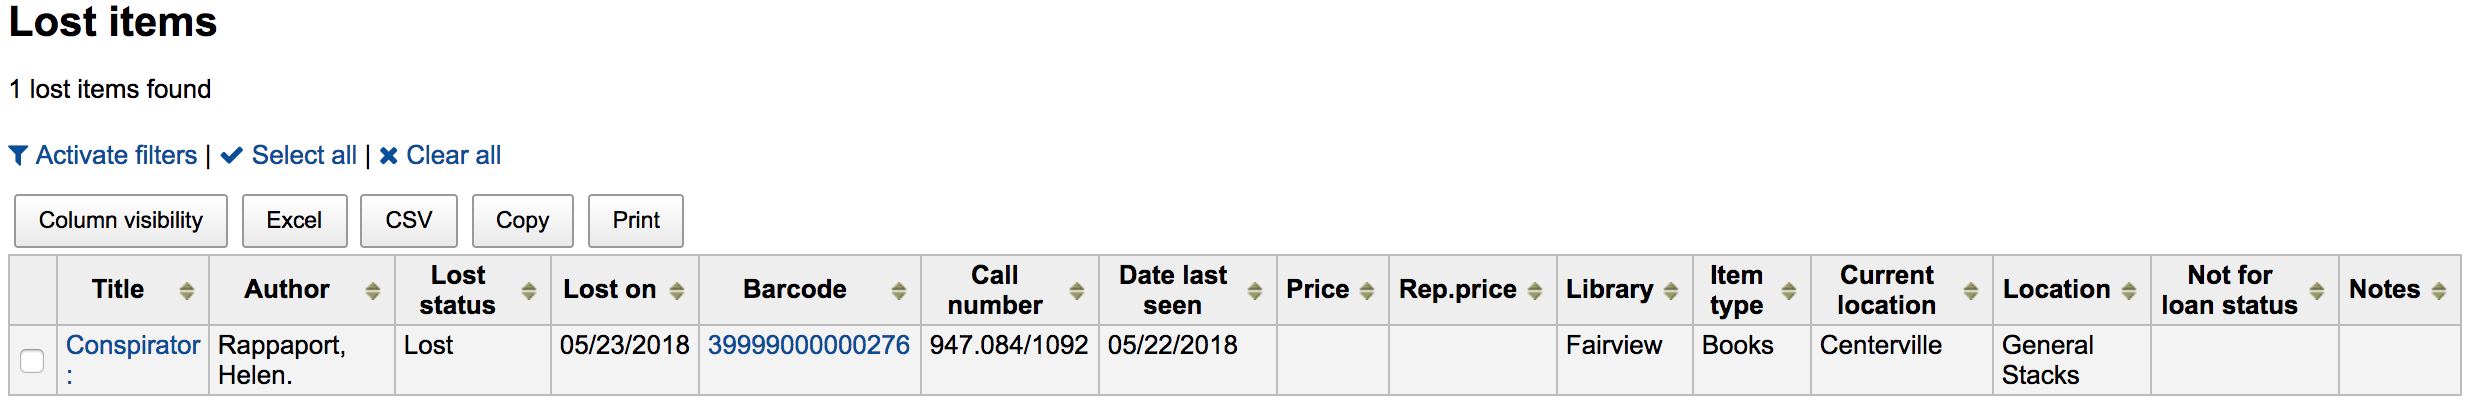
Lost items
This report will allow you to generate a list of items that have been marked as Lost within the system
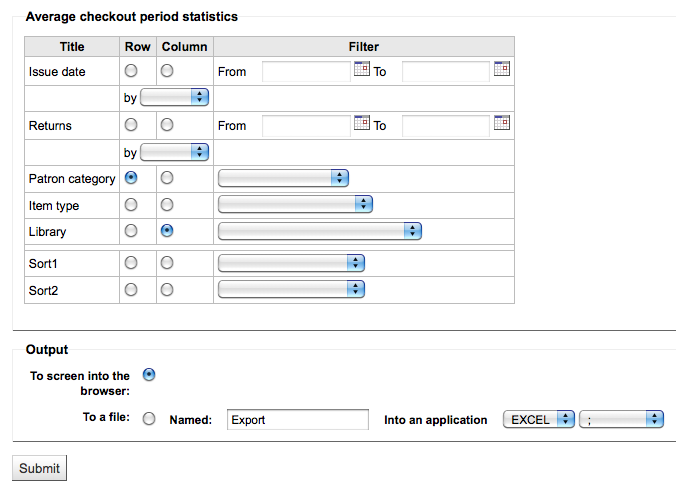
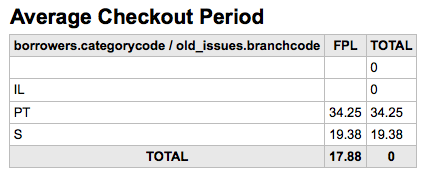
Average loan time
This report will list the average time items are out on loan based on the criteria you enter:
Wenn Sie sich für die Ausgabe im Browser entscheiden, werden die Ergebnisse direkt angezeigt.
Sie können auch eine Datei exportieren und dann mit anderen Werkzeugen weiter bearbeiten.
Report dictionary
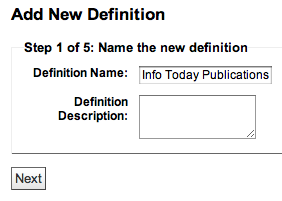
The report dictionary is a way to pre-define common filters you’d like to apply to your reports. This is a good way to add in filters that the report wizard doesn’t include by default. To add a new definition, or filter, click ‚New definition‘ on the reports dictionary page and follow the 4 step process.
Schritt 1: Benennen Sie die Definition und erfassen Sie eine Beschreibung
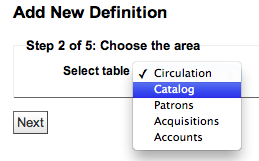
Schritt 2: Modul auswählen
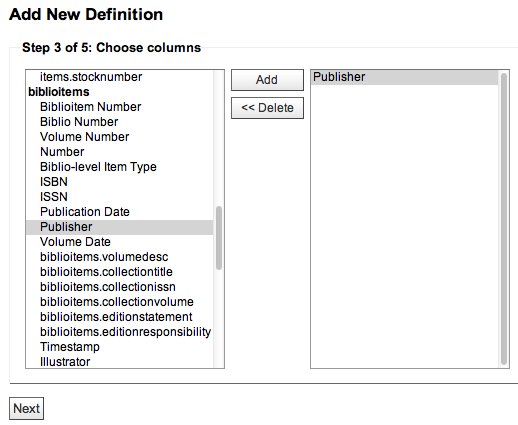
Schritt 3: Wählen Sie die Spalten für den Report aus den angezeigten Tabellen
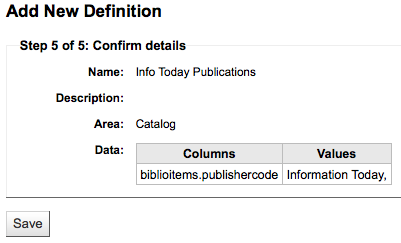
Schritt 4: Wählen Sie die Werte der Felder. Diese werden automatisch mit Werten aus Ihrer Datenbank gefüllt.
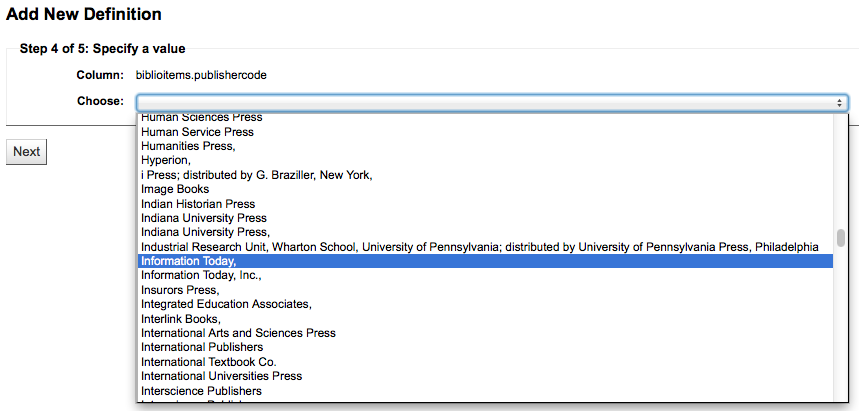
Bestätigen Sie Ihre Auswahl um die Definition zu speichern.
Ihre Definitionen werden auf der Wörterbuchseite angezeigt
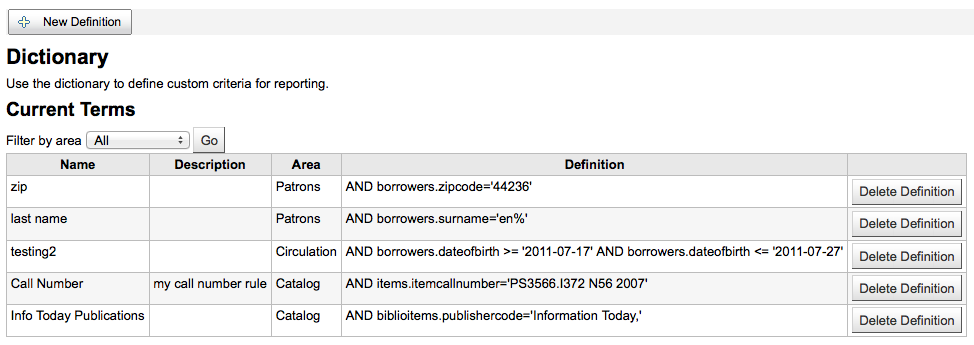
Wenn Sie dann einen neuen Report erstellen, wird Ihnen im Modul für welches die Definition erstellt wurde, diese in der Liste der Filter angeboten.